Unlocking the potential of rooftop solar
At 5c per kWh, we know that Australian solar generates the cheapest energy in the world but how does it stack up against coal when comparing the land required to generate electricity?
Rewiring Australia has calculated that solar panels only need 66% of the land required to generate and deliver electricity from Victoria’s coal-fired power stations to our urban centres.
Examining data from across the state, Victoria’s coal-fired power stations require:
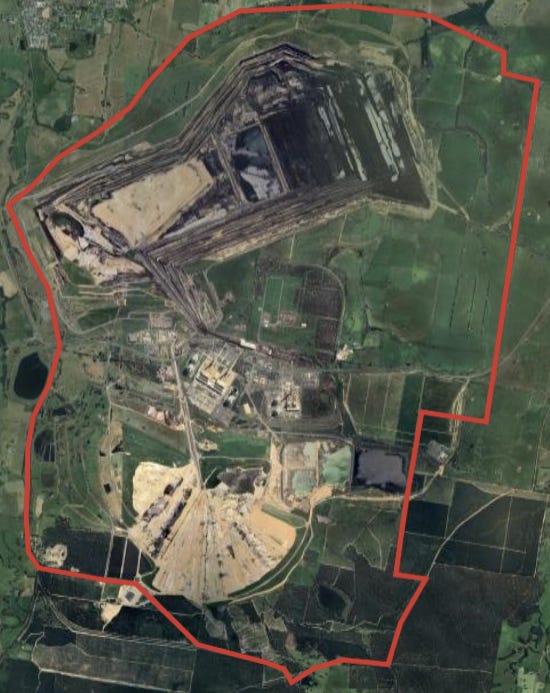
9,900 ha1 for open-cut coal mines, power stations and surrounds, for the cooling towers, ponds, and coal sheds.
7,700 ha2 for transmission lines to get the power to urban centres.
By contrast, we only require 11,665 ha3 of solar panels to generate the same 31,411 GWh/yr4 of power.
Solar uses slightly more land if we just consider the power stations and mines (118%). But that number drops to 66% when we factor in the area the transmission lines required to deliver electricity to our urban centres.
Add solar to existing infrastructure
The beauty of solar is that we can incorporate it into our existing assets and mitigate our need to acquire more land. And for our many urban use cases we don’t need transmission lines to move electricity from source to consumer. Our roofs can keep on protecting us from the rain, AND power our buildings at the same time. Note that a solar array over a single parking spot of 3x6m in Australia produces enough electricity to drive the vehicle underneath more than 20,000km per year.
“By installing solar panels on rooftops and car parks, we can reduce large-scale infrastructure builds and still generate more electricity than coal power stations,” says Rewiring Australia’s chief scientist Dr Saul Griffith. “The lowest cost energy system will maximise locally produced solar, whether that is on your rooftop or over the parking lot at the supermarket or the roof of the local warehouses.”
This work is part of a larger piece of research by Rewiring Australia exploring the different ways existing infrastructure can be utilised to generate solar power, which is much cheaper because it cuts out the transmission, distribution and retail costs of existing wholesale electricity.
Dr Griffith explains, “Repurposing existing energy infrastructure, such as open cut coal pits, transmission corridors, rail corridors, and gas transmission corridors will lower the number of new transmission lines and large scale renewable projects required to achieve our national energy transition to a nation run on zero emission electricity.”
Some other inconvenient truths about coal
When looking at maps of coal power stations, you notice the other reasons communities don’t like living next to them:
They make a mess of the landscape: Creative communities turn old coal mines into garbage tips.
They are unhealthy: Pollution from coal-fired power stations cost Australians around $2.4 billion in health costs annually.
They contribute to climate change: Australia still emits more greenhouse gas from burning coal on a per capita basis than other G20 countries despite a significant rise in solar and wind energy.

Author: Cameron Shorter
Calculated from site maps for Loy Yang and Yallourn, https://www.agl.com.au/content/dam/digital/agl/documents/about-agl/how-we-source-energy/loy-yang-power-station/agl-loy-yang-sustainability-report-2016-17.pdf, https://www.energyaustralia.com.au/sites/default/files/2020-07/Electrical%20Line%20Clearance%20Plan.pdf
Assume a quarter of Victoria’s transmission lines are dedicated to the quarter of Victoria’s energy generated by coal, and that there is 50m of cleared land under all power lines. Combines Geoscience Australia’s Electricity Transmission Lines Spatial Dataset, https://ecat.ga.gov.au/geonetwork/srv/eng/catalog.search#/metadata/83105 with Australian Bureau of Statistics Mesh Block data to determine Rural vs Parkland vs Urban land, https://www.abs.gov.au/statistics/standards/australian-statistical-geography-standard-asgs-edition-3/jul2021-jun2026/access-and-downloads/digital-boundary-files
Assumes solar panels produce 200W/Sqm, solar capacity of 15%.
Australian Energy Statistics 2023 Table O9.2, https://www.energy.gov.au/publications/australian-energy-update-2023


